> Cogniomics


Human brain is a tangible organ. However, the mind is probably one of the most unfathomable entities.
Human brain suffers from disorders like Schizophrenia, Alzheimer’s disease, epilepsy, depression,etc.
Photocredit : alz.org
Can technology, with AI (Artificial Intelligence) per se, help with any of these disorders ?
Photocredit : Stockimages
We also use AI in audio and visual data to find specific speech and motor cues like reduced gestures, facial expressions, flattened affect commonly associated with problems like depression, etc..

We extended the technology to various applications like:
Detecting inappropriate content online
Detecting insider threat
Analyzing learning environment

We are creating conceptual frameworks and technologies for comprehensive human behavioral analysis in real-life environments!

Patient or Healthy?
Speech & Video API

We, at Dauwels Lab, use AI to monitor and find patterns in EEG to check any early signs of disorders like seizures, epilepsy, Alzheimer's disease, etc.
>> Computational Neuroscience & Neural Signal Processing
3. Computational Modeling of Epileptic Seizures
4. Mathematical Approach to Controlling Epileptic Seizures
5. Analysis of Paroxysmal Gamma Waves in Meditation EEG
6. Flexible Near-Losless Multi-Channel EEG Compression using Wavelets and Matrix/Tensor Decompositions

Photocredits: salesforce.com
2. Technologies for 21st Century Learning and Education - Victoria to send to content
>> National Security
National security is a concept that a government, along with its parliaments, should protect the state and its citizens against all kind of "national" crises through a variety of power projections, such as political power, diplomacy, economic power, military might, and so on. Algorithms are being developed for the above mentioned concept which can be applied in its various aspects.

Mathematical Approach to Controlling Epileptic Seizures
Time Line
Ongoing since 2013
Team
Justin Dauwels, Nishant Sinha (Nanyang Technological University), P. N. Taylor (Newcastle University, UK), S. S. Cash (MGH and Harvard Medical School), Justin Ruths (Singapore University of Technology and Design).
Problem
Nearly one-third of epilepsy patient continue having seizures despite treatment with anti-epileptic drugs. When the seizures consistently originate from a specific area of the brain (focal seizures), surgical removal of those cortical tissues might abate seizures. Predicting the likelihood of surgical success prior to performing surgery would be an important tool for neuro-surgeons toward achieving a successful surgery. As an alternative to surgery, stimulation of the brain at selected locations via electrical or other signals may lead to seizure abatement. To this end, it is crucial to determine suitable locations for stimulation, and to design appropriate stimuli for seizure abatement, while taking into account the heterogeneous dynamics of the human brain.
Contribution
We developed computational models of focal seizures, based on patient data. Specifically, we infer the functional connectivity from the patient's ECoG and use it in computational models to replicate the dynamics of epileptic brain activities. Simulations were carried out in this model to determine brain areas that significantly reduce the seizure likelihood when resected. These regions were often found to be highly correlated with the clinically resected areas (see Figure 1).
We also develop computational models to simulate generalized seizures. We applied optimal control theory to design optimum stimuli to abate these simulated seizures. A moving window controller was derived, which monitors the system state in real-time. When a seizure is detected, the ensemble control is triggered which drives the state to a stable equilibrium, thereby stopping the seizure (see Figure 2).
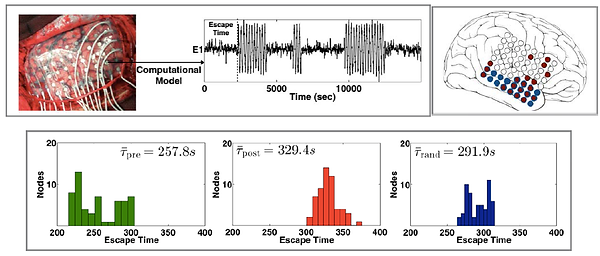
Figure 1: The top panel on the left shows the simulated model dynamics & escape time for one of the channels when model parameters are inferred from the clinical interictal ECoG recording. The top right panel shows the optimal brain areas (in red) which should be resected to reduce seizure likelihood. These areas were found to be correlated with clinically determined seizure focus (in blue). The relative shift in the histogram of the bottom panel represents the reduction in seizure likelihood (or increase in escape time) in cases of no resection (in green), resection of simulated brain areas (in red) and random resection (in blue).

Figure 2: The top left panel shows a heterogeneous model of the brain with four cortical compartments and one thalamic compartment. The top right panel shows a moving window controller that detects and stops seizures as they occur. Boxplots represent the aggregate statistics for controlled and uncontrolled seizure durations over a wide range of kick parameters. The bottom panel on the left shows the uncontrolled seizures simulated from the heterogeneous model and the bottom panel on the right shows the controlled seizures when optimal stimuli (shown in the inset axis) were applied.
Reference
N. Sinha, P. N. Taylor, J. Dauwels, and J. Ruths, Development of optimal stimuli in a heterogeneous model of epileptic spike-wave oscillations, 2014 IEEE International Conference on Systems, Man, and Cybernetics (SMC2014), 2014, in press (invited paper). [ PDF ]
N. Sinha, J. Dauwels, Y. Wang, S.S. Cash, P. Taylor, An in Silico Approach for Pre-Surgical Evaluation of an Epileptic Cortex, 36th Annual International Conference of the IEEE Engineering In Medicine And Biology Society (EMBC 2014), 2014, in press. [ PDF ]
J. Ruths, P. Taylor, J. Dauwels, Optimal Control of an Epileptic Neural Population Model, Proceedings of the International Federation of Automatic Control (IFAC), Cape Town, 2014.
Analysis of Paroxysmal Gamma Waves in Meditation EEG
Time Line
Ongoing since 2011
Team
JD, Jing Jin, Manuel Vazquez (Universidad Carlos III de Madrid), Francois B. Vialatte (ParisTech, EPSCI), Andrzej Cichocki (RIKEN BSI, Japan)
Problem
Meditation is a fascinating topic, yet has received limited attention in the neuroscience and signal processing community so far. Strong EEG activity has been observed in the left temporal lobe of meditators. Meditators exhibit more paroxysmal gamma waves (PGWs) in active regions of the brain. The knowledge of the PGW distribution may lead to a better understanding of the brain activity during meditation. However, comprehensive PGW marking is time consuming due to the high density, which motivates us to develop automated PGW detection methods.
Contribution
We are currently modeling traffic parameters as signals residing on a graph (spatial variable) instead of time series. We are developing different filtering techniques to analyze the behavior of traffic parameters such as speed, flow and travel time as spatial variables. Such analysis can potentially provide us with better mechanisms to model and limit traffic congestion in road networks.
We have also analyzed the synchrony between PGWs, revealing functional connectivity patterns in the brain during BhPr. Specifically the method of Stochastic Event Synchrony (SES) is applied to pairs of PGW sequences in order to assess their synchrony. From those pair-wise synchrony measures, large-scale functional connectivity patterns are inferred.
Strong synchrony can be observed in the temporal lobes for all subjects, in addition to long-range inter-hemispheric connections. Consistent connectivity patterns are present for exhalation periods, while those patterns are substantially less stationary for inhalation periods. Interestingly, the synchrony seems to increase gradually during the meditation session. Moreover, the distribution of synchrony values seems to depend on the level of expertise in practicing BhPr: the higher the expertise, the more concentrated the intensity values.
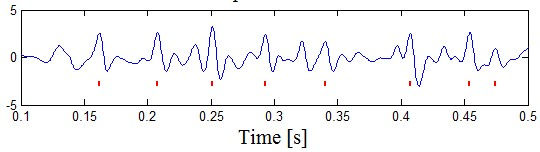
Figure 1: Examples of PGWs found in meditation EEG


Figure 2: Diagram of the proposed procedure (left) and PGWs from 2 different clusters via K-means (right).

Figure 3: Back projection of PGW rate from (a) raw data; (b) single source; (c) multiple sources; (d) cluster 1 PGWs only and; (e) cluster 2 PGWs only.

Figure 4: Connectivity map with connection strength in color (left), and EEG (right) with extracted PGW sequences from a pair of (a) adjacent channels and (b) distant channels.

Figure 5: Power distribution and connectivity networks three subjects (B, I, and E) with three successive periods of (a) exhalations, and (b) inhalations. L is the total number of connections, and Navg is the average PGW count of each connection.
Reference
M.A. Vazquez, Jing Jin, J. Dauwels, F.B. Vialatte, Automated Detection of Paroxysmal Gamma Waves in Meditation EEG, ICASSP 2013. [ PDF ]
Jin Jing, J. Dauwels, F.B. Vialatte, A. Cichocki, Synchrony Analysis of Paroxysmal Gamma Waves in Meditation EEG, ICASSP 2014, May 4-9, 2014, Florence, Italy, in press. [ PDF ]
Flexible Near-Losless Multi-Channel EEG Compression using Wavelets and Matrix/Tensor Decompositions
Time Line
Ongoing since 2010
Team
JD, Srinivasan K, Andrzej Cichocki (RIKEN BSI, Japan), M Ramasubba Reddy (IIT Madras, India)
Problem
Electroencephalogram (EEG), the recording of electric potentials on the human scalp, is primarily used for disease diagnosis in clinical settings. Many other applications and studies also utilize EEG and hence the amount of recordings is increasing every day. For example, let us consider the intracranial EEG recordings made to evaluate the epilepsy brain surgery; a 320 micro- and macro-electrode array recording at 32kHz sampling rate with 18-bit resolution generates nearly 3 terabytes of data per day. Usually the person undergoing such surgery is monitored in NICU for several days and this amounts to a huge data. Storing, processing, analysis, and transmission of such EEG datasets is a humongous task. Compression of multichannel EEG is a straightforward solution for the above-mentioned problems, and a flexible compression system can be tuned appropriately to the application at hand.
Contribution
First we formulated a two-dimensional representation for the single-channel EEG, and this formulation is extended further to multichannel EEGs in our subsequent works. The multichannel EEG is arranged in the form of 2D (matrix/image), 3D (volume/3-way tensor), and 4D (4-way tensor) to effectively exploit the redundancies (correlations) present in them. In the first stage of compression, we used wavelet transforms and matrix/tensor decompositions to exploit the redundancies from multichannel EEG; further, we deploy a coding stage to effectively represent the wavelet coefficients/decomposition components. In the second stage of compression, the residual error obtained from the first stage is subjected to entropy coding after quantization for further compression. The quantization provides strict error control in the reconstructed signal and thus the reconstructed signal has sufficient accuracy required for most purposes. We noticed that tensor based compression schemes provide attractive compression performance and best error performance compared to other schemes. We are planning to tailor, evaluate, and deploy our compression algorithms in clinical settings in the near future.


Figure: EEG compression performance of wavelet-based volumetric coding, subband specific arithmetic coding, and PARAFAC based coding. For the PARAFAC based approach, the average reconstruction error is about 6% for a compression rate of 10, while the worst-case reconstruction error is limited to 1% (not shown here) . The average reconstruction error is lower for subband specific arithmetic coding, however, the corresponding worst-casereconstruction error is substantially larger.
Figure: Near-lossless reconstruction of EEG. The original signal is shown at the top. The error signal is superimposed on the reconstructions; the performance measures are mentioned at the right side are CR-Compression Ratio, PRD-Percent Root-Mean-Square Difference, PSNR-Peak Signal-to-Noise Ratio.
Reference
J. Dauwels, K. Srinivasan, M. Ramasubba R., and A. Cichocki, Near-lossless multi-channel EEG compression based on matrix and tensor decompositions, IEEE Transactions on Information Technology in Biomedicine, 2013. [ PDF ]
K. Srinivasan, J. Dauwels, M. Ramasubba R., Multichannel EEG compression: Wavelet-based image and volumetric coding approach, IEEE Transactions on Information Technology in Biomedicine, 2013. [ PDF ]
K. Srinivasan, Justin Dauwels, and M. Ramasubba Reddy, A two-dimensional approach for lossless EEG compression, Biomedical Signal Processing and Control, Volume 6, Issue 4, October 2011, Pages 387-394. [ PDF ]